Decode Gene Expression in Minutes
GenoLens transforms raw RNA-seq count matrices into publication-ready biological insights. Differential expression, clustering, pathway enrichment, and AI-generated narrative interpretation all in one platform.
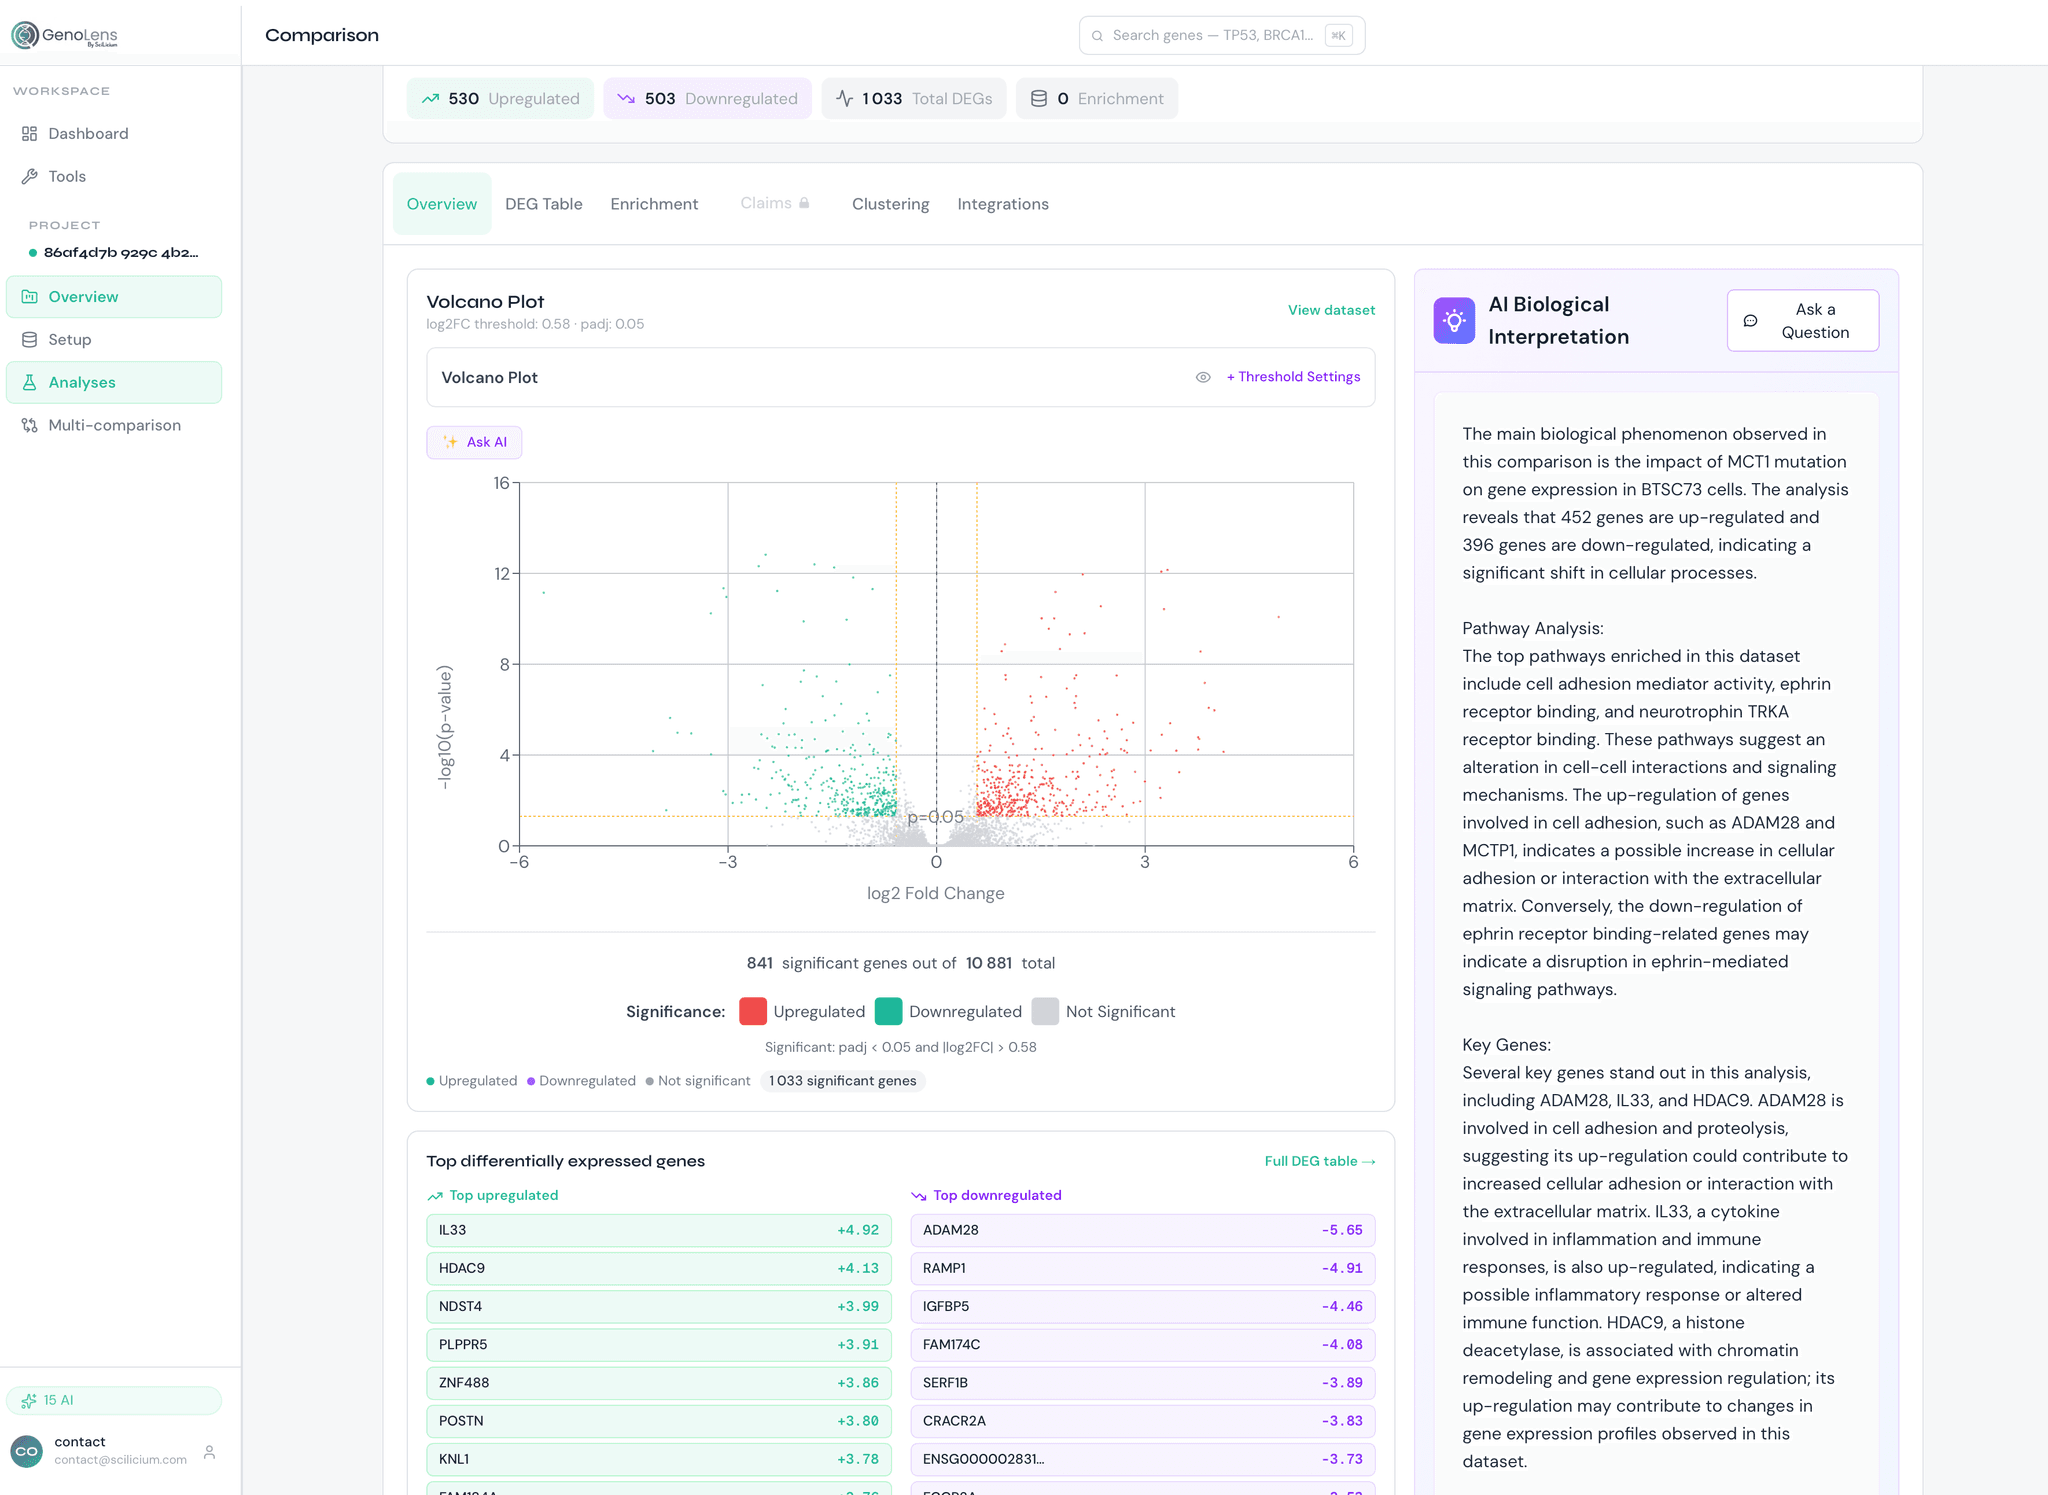
“The treated sample shows significant upregulation of innate immune response genes (NFκB pathway, p<0.001), alongside suppression of cell cycle progression markers…”
Platform Capabilities
Everything your lab needs,
nothing it doesn’t
From upload to publication-ready insights in a single, reproducible workflow designed for genomics scientists.
Differential Expression
DESeq2/EdgeR-equivalent pipeline. Multi-group contrasts, Wald test, BH-FDR correction, full reproducibility.
Clustering & Dim. Reduction
K-means, hierarchical clustering. PCA, UMAP, t-SNE with configurable colour overlays and silhouette scoring.
Pathway Enrichment
GO, KEGG, Reactome enrichment via Fisher's exact test + GSEA. Bubble charts, enrichment maps, leading edges.
AI Interpretation
Our custom LLM generates structured biological narratives: mechanisms, literature context, and experimental follow-up.
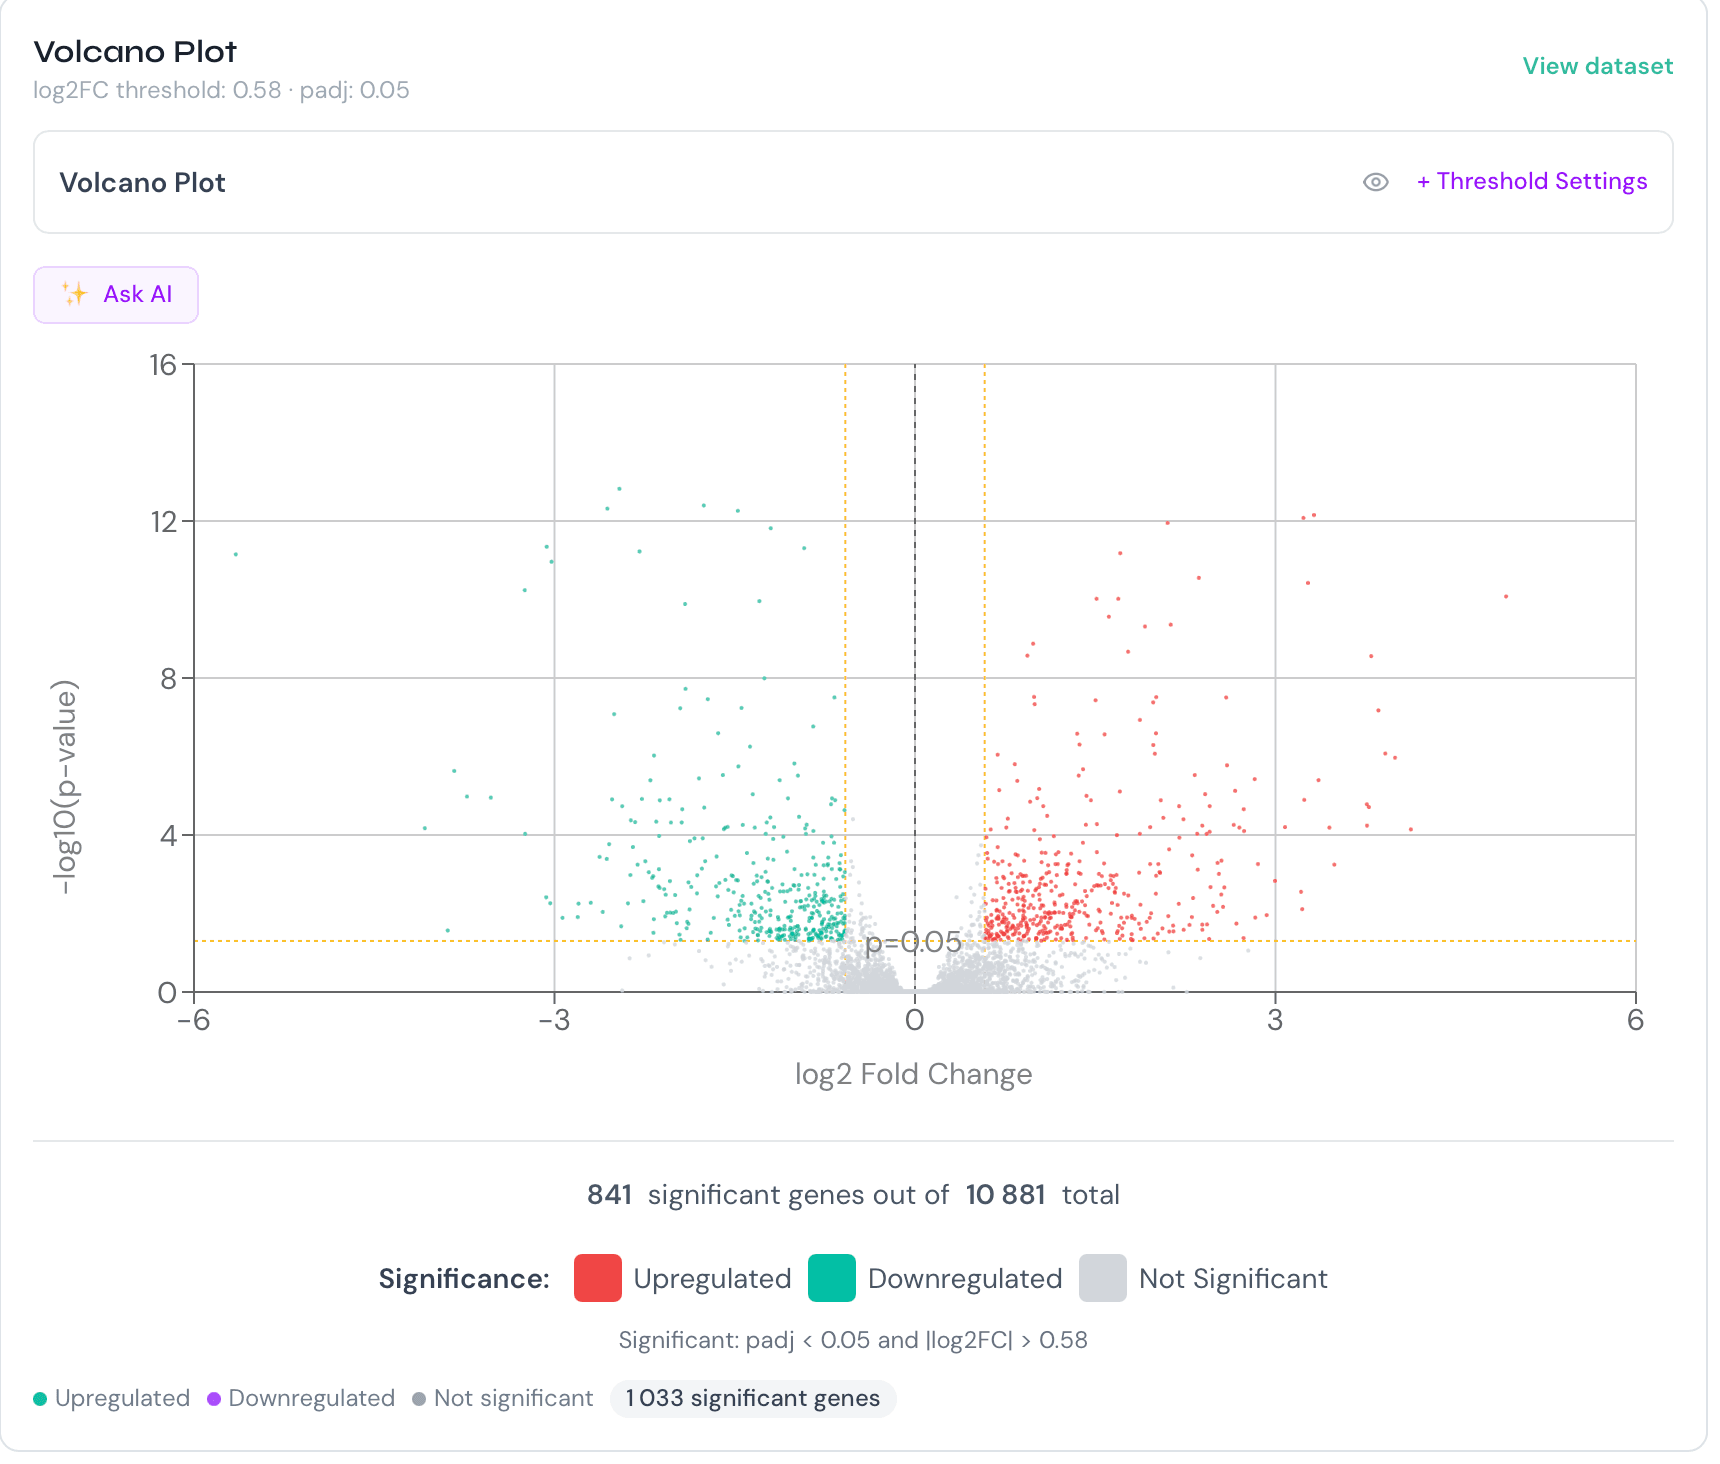
Interactive Visualizations
Volcano plots, heatmaps, dot plots. Interactive Plotly in browser. Export SVG/PNG (300 DPI) or share links.
REST API & Automation
Python & R SDKs, Nextflow module, Snakemake wrapper, webhooks. Full OpenAPI 3.0 spec with Swagger UI.
Workflow
From raw counts to insights
in three steps
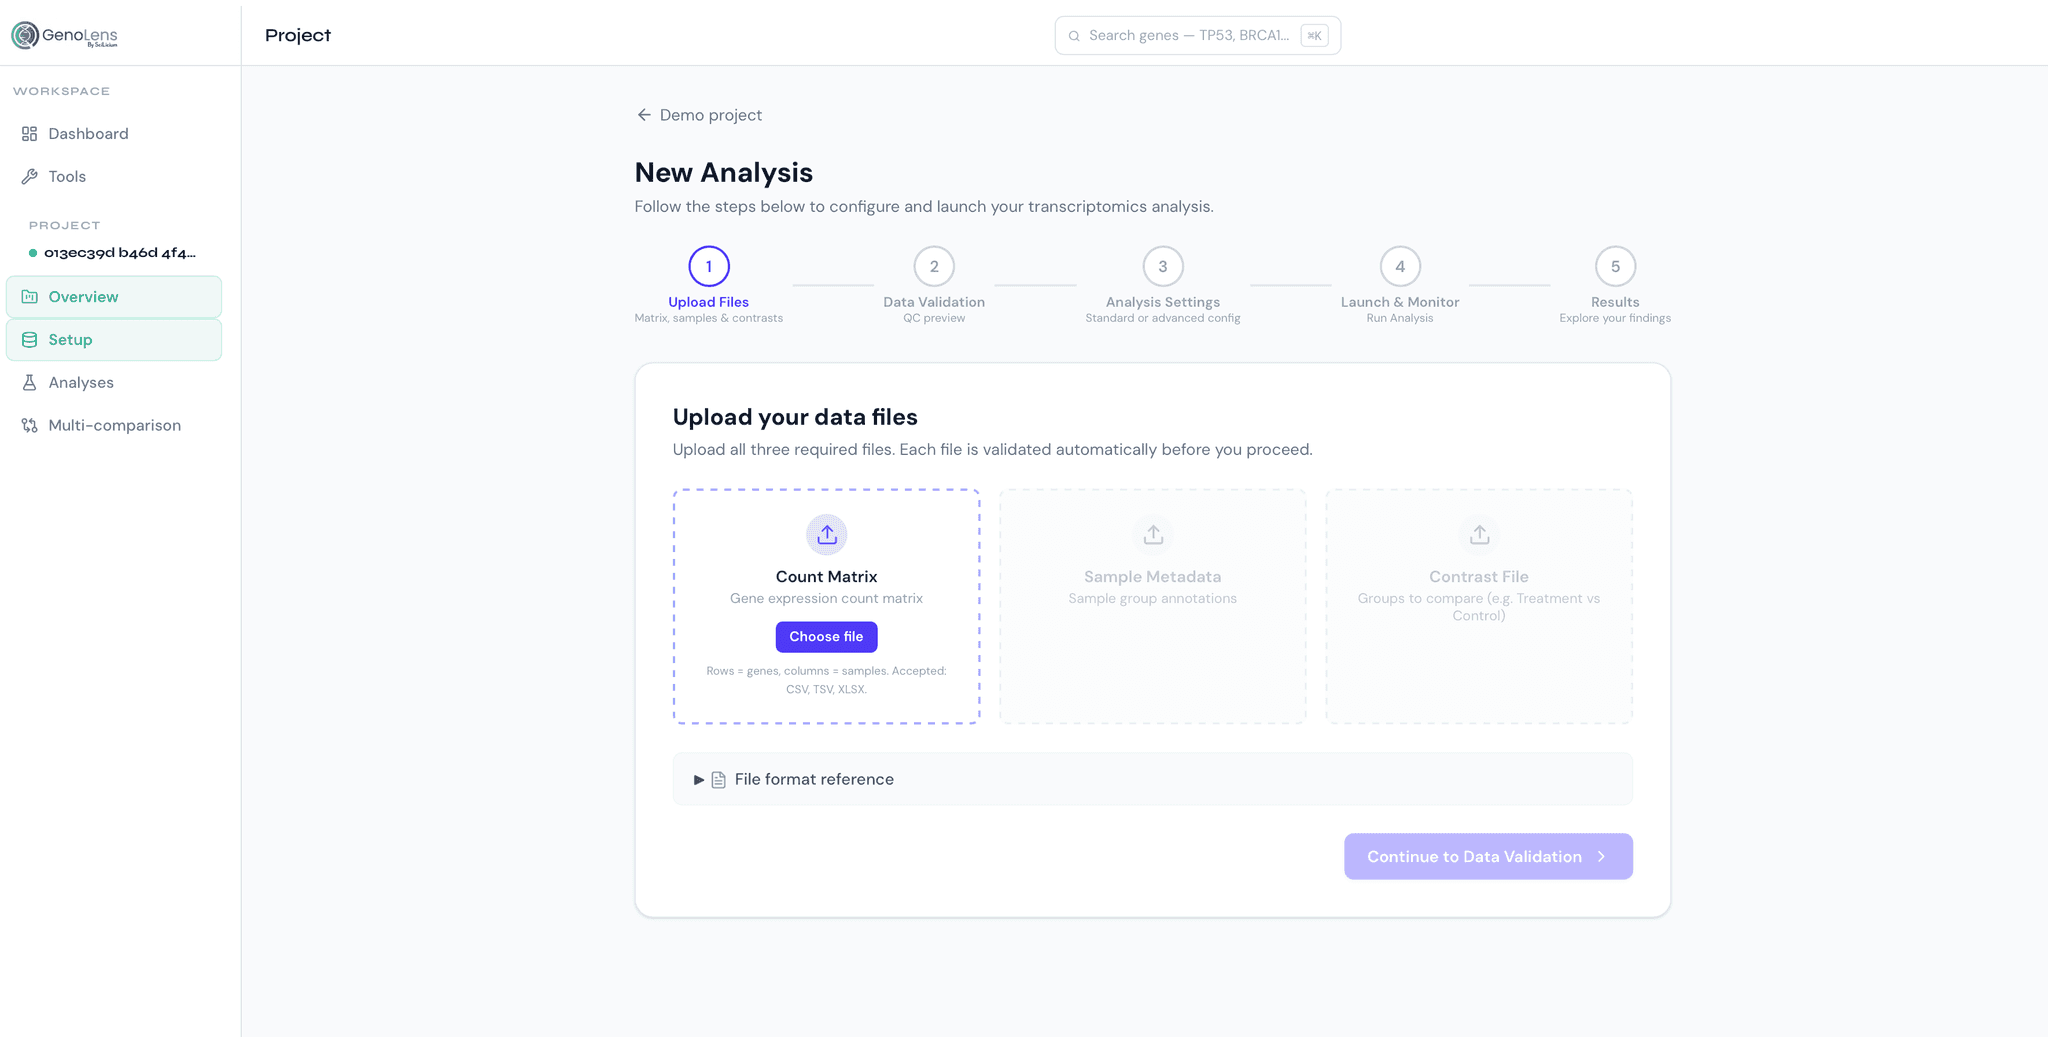
Upload Your Data
Drag-and-drop count matrix (CSV/TSV/XLSX) or API. GenoLens validates format, maps gene identifiers, converts to optimised Parquet.
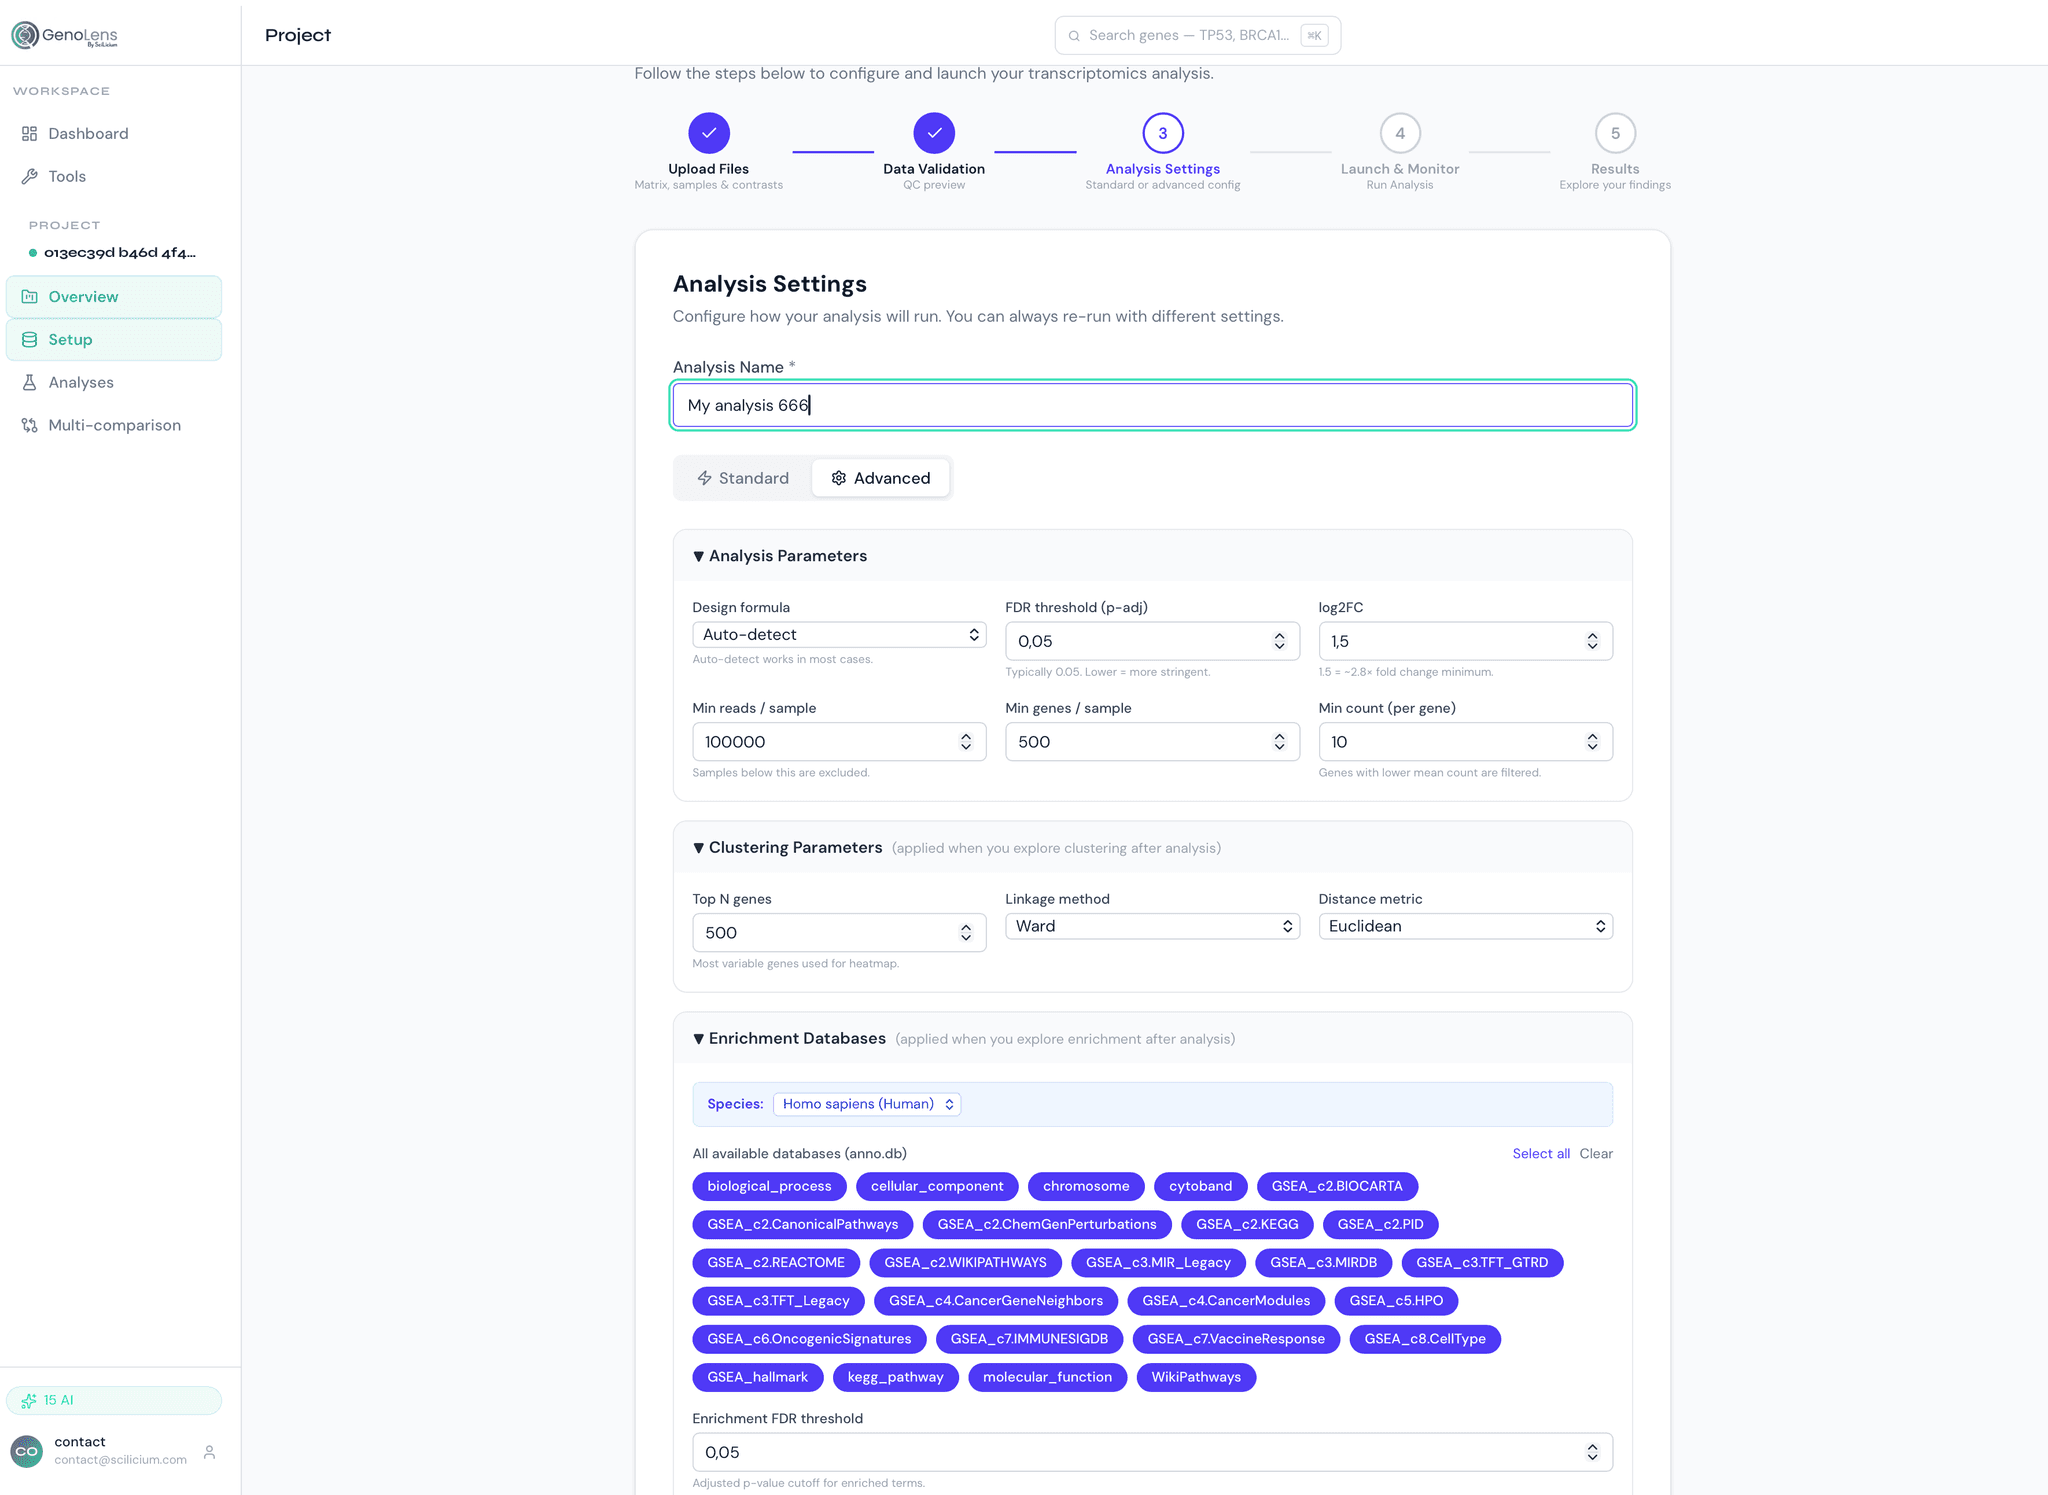
Configure & Analyse
Define sample groups, normalisation, and analyses. DEG, clustering, and enrichment run concurrently via cloud task queue.
Explore & Interpret
Browse interactive dashboards, request AI narrative, export figures, share reproducible links with reviewers.
Get Started Today
Ready to decode your transcriptome?
No IT setup, no bioinformatics PhD required.