Platform Features
A complete analytical suite
for omics technologies
GenoLens integrates every step of the RNA-seq workflow into one reproducible, cloud-native platform. From raw counts to biological interpretation.
Differential Expression Analysis
Identify statistically significant changes in gene expression between conditions. GenoLens implements DESeq2 and edgeR statistical models, adapted for cloud execution with full reproducibility guarantees.
- Accepts raw counts, TPM, FPKM, or CPM matrices (CSV/TSV/XLSX)
- Negative binomial modelling with automatic dispersion estimation
- Multi-group contrasts and paired sample experimental designs
- Wald test with Benjamini-Hochberg FDR correction
- Exportable results: log₂FC, p-value, padj, mean expression
Clustering & Dimensionality Reduction
Reveal hidden structure in expression data. Apply state-of-the-art algorithms to group samples and genes, enabling biological subtype discovery and robust QC.
- K-means and hierarchical clustering with configurable distance metrics
- PCA, UMAP, and t-SNE with adjustable parameters and colour overlays
- Silhouette score and elbow method for optimal cluster number selection
- Interactive heatmaps with bi-clustering and row/column dendrograms
- Batch effect visualisation and ComBat correction diagnostics
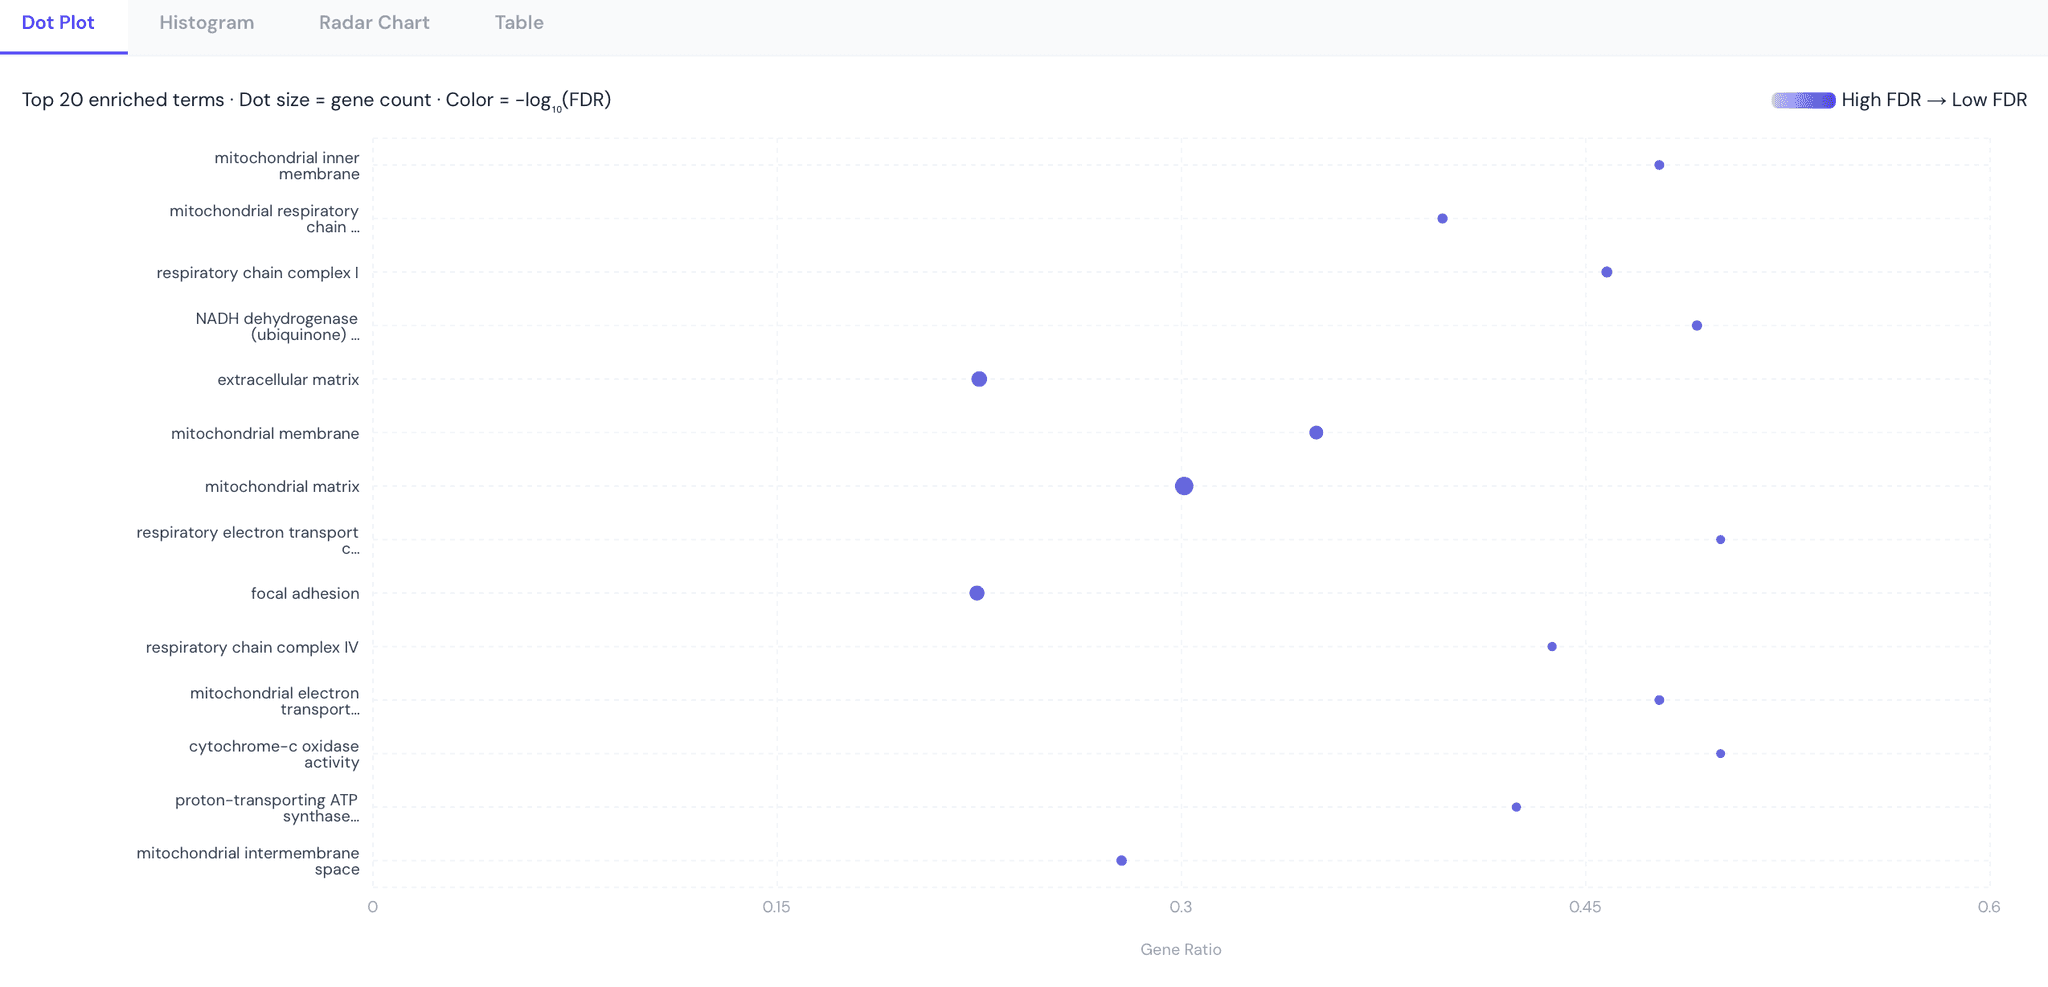
Pathway Enrichment Analysis
Move beyond gene lists to biological meaning. GO, KEGG, and Reactome enrichment with GSEA, giving statistical context to your differential expression results.
- Gene Ontology (BP, MF, CC) with Fisher's exact test + FDR
- KEGG pathway and Reactome gene set enrichment analysis
- Pre-ranked GSEA with NES, p-value, and leading-edge gene sets
- Enrichment bubble chart, bar plot, and network visualizations
- Custom gene set upload (MSigDB, in-house signatures)
“The transcriptomic response to TGF-β stimulation reveals coordinated activation of canonical TGF-β/SMAD signalling (SMAD2/3, TGFBR1/2 upregulated; FDR < 0.001), accompanied by strong suppression of the MYC transcriptional program. Genes in the oxidative phosphorylation pathway show significant downregulation (NES = −2.31), consistent with metabolic reprogramming during EMT.“
“Recommended follow-up: Western blot validation of SMAD3 phosphorylation, and scRNA-seq to resolve cell-type-specific responses.“
Biological AI Interpretation
GenoLens’s AI synthesises your statistical results with the latest biomedical literature to generate structured biological narratives where the mechanistic insights typically requiring hours of expert review.
- Structured narrative: mechanism → context → hypotheses → next steps
- Powered by a custom open-source LLM trained and hosted on SciLicium servers
- Fine-tuned on transcriptomics literature, no data ever sent to third-party AI
- Configurable scope: mechanism, clinical, drug discovery, cosmetics
- Export as PDF report or copy as manuscript-ready text
Publication-Ready Visualizations
Every chart is interactive in the browser and exportable in publication-quality formats. No more manual figure preparation in external tools.
- Volcano plots, MA plots, expression heatmaps, box plots
- UMAP/PCA scatter plots with configurable colour overlays
- Pathway enrichment bubble charts and dot plots
- Export to SVG, PNG (300 DPI), and PDF
- Shareable interactive links for reviewers and collaborators
API & Pipeline Integrations
GenoLens is built API-first. Embed in Nextflow/Snakemake pipelines, automate batch analyses, or build custom dashboards.
- RESTful API with OpenAPI 3.0 spec and interactive Swagger UI
- Python SDK and R client with full type hints and documentation
- Nextflow module and Snakemake wrapper on nf-core
- Webhook callbacks for async job completion
Ready to analyse
Discover GenoLens today
Upload your first dataset in minutes. No configuration, no pipeline setup.